Posts
In clinical studies, especially in RCTs, It is important to present the flow diagram of the patients. There are some packages like {visR} in producing diagram.
In this tutorial, I preferred manual diagram as I do in my practice.
Selected article:
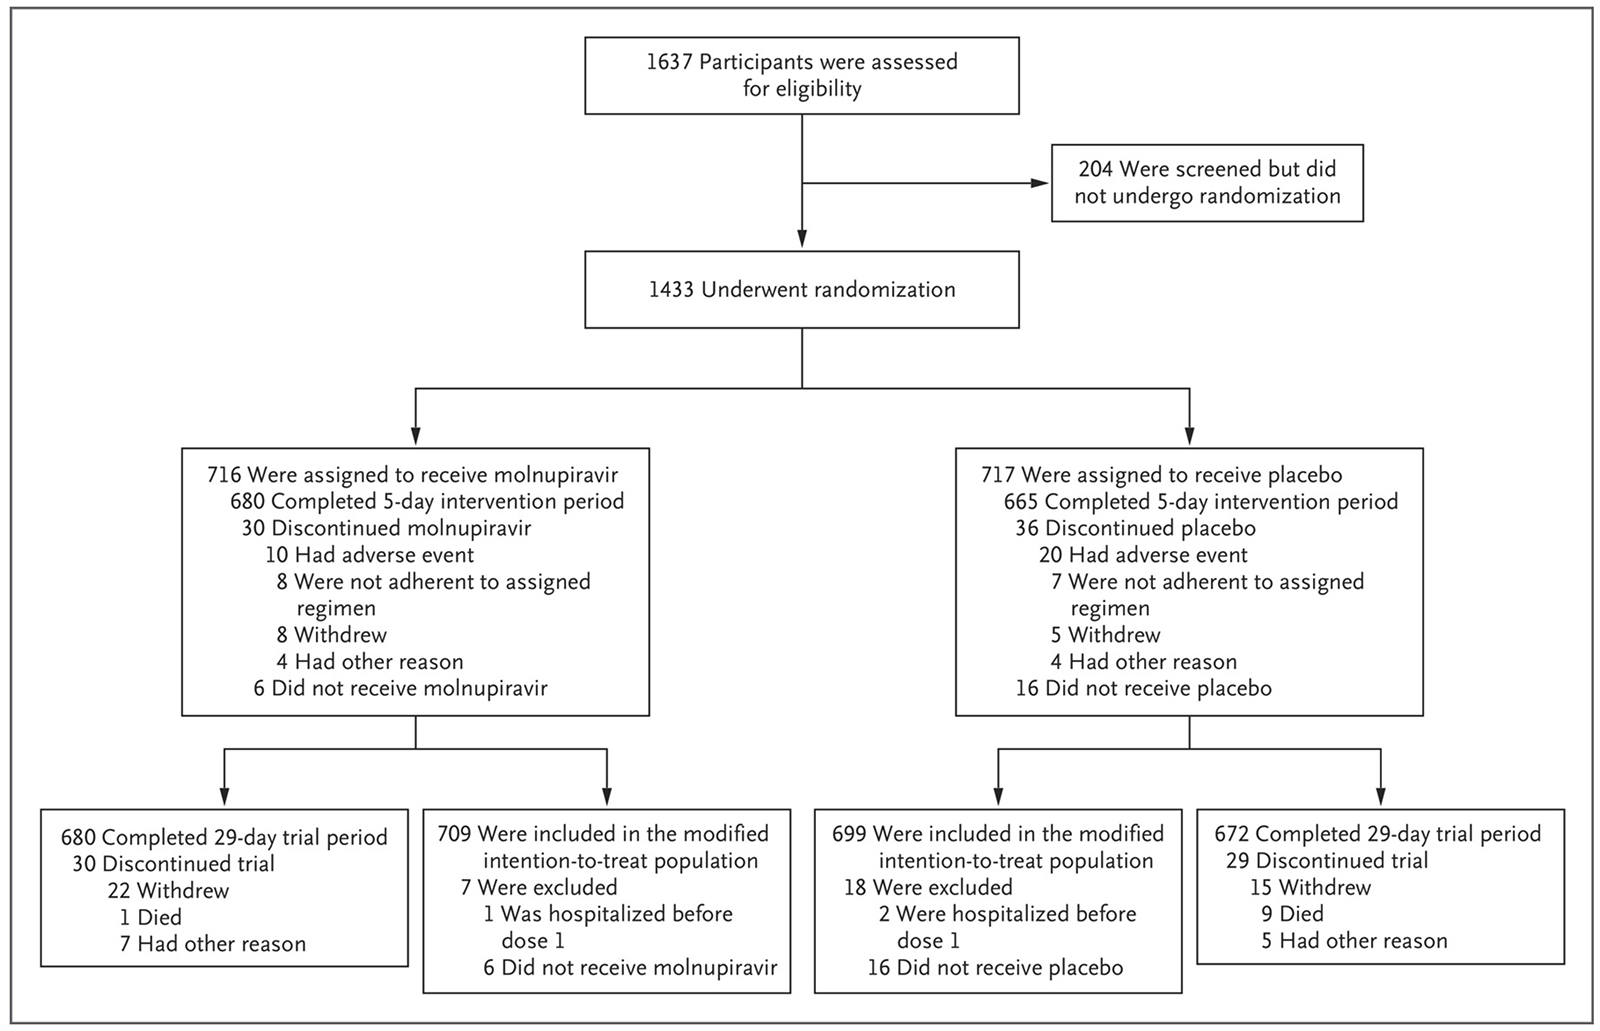
Title: Molnupiravir for Oral Treatment of Covid-19 in Nonhospitalized Patients
Journal: The New England Journal of Medicine
Authors: Bernal AJ, Gomes da Silva MM, Musungaie DB et al.
Year: 2022
PMID: 34914868
DOI: 10.1056/NEJMoa2116044
The original figure
Import libraries
suppressPackageStartupMessages(library(tidyverse))
suppressPackageStartupMessages(library(fabricatr))
suppressPackageStartupMessages(library(glue))
suppressPackageStartupMessages(library(ggtext))

theme_set(theme_linedraw(base_family = "Source Sans Pro"))
Prepare fabricated data
# Molnupiravir group
set.seed(2022)
N1 <- 716
molnupiravir <- tibble(
  allocated = "randomization",
  group = "molnupiravir",
  completed = c(rep("yes", 680), rep("no", N1-680)),
  adverse = c(rep("yes", 10), rep("no", N1-10)),
  not_adherent = c(rep("yes", 8), rep("no", N1-8)),
  withdrew = c(rep("yes", 8), rep("no", N1-8)),
  other = c(rep("yes", 4), rep("no", N1-4)),
  not_received = c(rep("yes", 6), rep("no", N1-6)),
  completed_29 = c(rep("yes", 680), rep("no", N1-680)),
  withdrew_trial = c(rep("yes", 22), rep("no", N1-22)),
  died = c(rep("yes", 1), rep("no", N1-1)),
  other_trial = c(rep("yes", 7), rep("no", N1-7)),
  mod_itt = c(rep("yes", 709), rep("no", N1-709)),
  hospitalized = c(rep("yes", 1), rep("no", N1-1)),
  not_received_trial = c(rep("yes", 6), rep("no", N1-6))
)


# Placebo group
set.seed(2022)
N2 <- 717
placebo <- tibble(
  allocated = "randomization",
  group = "placebo",
  completed = c(rep("yes", 665), rep("no", N2-665)),
  adverse = c(rep("yes", 20), rep("no", N2-20)),
  not_adherent = c(rep("yes", 7), rep("no", N2-7)),
  withdrew = c(rep("yes", 5), rep("no", N2-5)),
  other = c(rep("yes", 4), rep("no", N2-4)),
  not_received = c(rep("yes", 16), rep("no", N2-16)),
  completed_29 = c(rep("yes", 672), rep("no", N2-672)),
  withdrew_trial = c(rep("yes", 15), rep("no", N2-15)),
  died = c(rep("yes", 9), rep("no", N2-9)),
  other_trial = c(rep("yes", 5), rep("no", N2-5)),
  mod_itt = c(rep("yes", 699), rep("no", N2-699)),
  hospitalized = c(rep("yes", 2), rep("no", N2-2)),
  not_received_trial = c(rep("yes", 16), rep("no", N2-16))
)

# Excluded group
N3 <- 204
not_randomized <-  tibble(
  allocated = c(rep("excluded", N3)),
  group = c(rep("not_randomized", N3))
)

combined_dataset <- bind_rows(
  not_randomized,
  placebo,
  molnupiravir
)
A part of fake dataset
combined_dataset %>%
        sample_n(10)
## # A tibble: 10 × 15
##    allocated  group   completed adverse not_adherent withdrew other not_received
##    <chr>      <chr>   <chr>     <chr>   <chr>        <chr>    <chr> <chr>
##  1 randomiza… placebo yes       no      no           no       no    no
##  2 randomiza… molnup… yes       no      no           no       no    no
##  3 randomiza… placebo yes       no      no           no       no    no
##  4 randomiza… placebo yes       no      no           no       no    no
##  5 randomiza… placebo yes       no      no           no       no    no
##  6 randomiza… placebo yes       no      no           no       no    no
##  7 randomiza… placebo yes       no      no           no       no    no
##  8 excluded   not_ra… <NA>      <NA>    <NA>         <NA>     <NA>  <NA>
##  9 randomiza… placebo yes       no      no           no       no    no
## 10 randomiza… molnup… yes       no      no           no       no    no
## # … with 7 more variables: completed_29 <chr>, withdrew_trial <chr>,
## #   died <chr>, other_trial <chr>, mod_itt <chr>, hospitalized <chr>,
## #   not_received_trial <chr>
Possible strategy:
In a original study dataset, categorization is different than the presented one. This is just for an example.
To make a reproducible diagram, all numbers should be defined with codes.
nrow(filter()) is my preference. Various ways can be used.
Then they can be added to an “empty canvas” with annotate(), geom_text(), geom_richtext() or etc.
# molnupiravir group
n_completed<- combined_dataset %>%
  filter(group == "molnupiravir",
          completed == "yes") %>% nrow()

n_adverse <- combined_dataset %>%
  filter(group == "molnupiravir",
          adverse == "yes") %>% nrow()

n_not_adherent <- combined_dataset %>%
  filter(group == "molnupiravir",
          not_adherent == "yes") %>% nrow()

n_withdrew <- combined_dataset %>%
  filter(group == "molnupiravir",
          withdrew == "yes") %>% nrow()

n_other <- combined_dataset %>%
  filter(group == "molnupiravir",
          other == "yes") %>% nrow()

n_discontinued <- n_adverse + n_not_adherent + n_withdrew + n_other

n_not_received <- combined_dataset %>%
  filter(group == "molnupiravir",
          not_received == "yes") %>% nrow()

n_molnupiravir <- n_completed + n_discontinued + n_not_received

n_completed_29 <- combined_dataset %>%
  filter(group == "molnupiravir",
          completed_29 == "yes") %>% nrow()

n_withdrew_trial <- combined_dataset %>%
  filter(group == "molnupiravir",
          withdrew_trial == "yes") %>% nrow()

n_died <- combined_dataset %>%
  filter(group == "molnupiravir",
          died == "yes") %>% nrow()

n_other_trial <- combined_dataset %>%
  filter(group == "molnupiravir",
          other_trial == "yes") %>% nrow()

n_discontinued_trial <- n_withdrew_trial + n_died + n_other_trial

n_mod_itt <- combined_dataset %>%
  filter(group == "molnupiravir",
          mod_itt == "yes") %>% nrow()

n_hospitalized <- combined_dataset %>%
  filter(group == "molnupiravir",
          hospitalized == "yes") %>% nrow()

n_not_received_trial <- combined_dataset %>%
  filter(group == "molnupiravir",
          not_received_trial == "yes") %>% nrow()

n_excluded <-  n_hospitalized + n_not_received_trial

# placebo group
n_completed_placebo <- combined_dataset %>%
  filter(group == "placebo",
          completed == "yes") %>% nrow()

n_adverse_placebo <- combined_dataset %>%
  filter(group == "placebo",
          adverse == "yes") %>% nrow()

n_not_adherent_placebo <- combined_dataset %>%
  filter(group == "placebo",
          not_adherent == "yes") %>% nrow()

n_withdrew_placebo <- combined_dataset %>%
  filter(group == "placebo",
          withdrew == "yes") %>% nrow()

n_other_placebo <- combined_dataset %>%
  filter(group == "placebo",
          other == "yes") %>% nrow()

n_discontinued_placebo <- n_adverse_placebo + n_not_adherent_placebo + n_withdrew_placebo + n_other_placebo

n_not_received_placebo <- combined_dataset %>%
  filter(group == "placebo",
          not_received == "yes") %>% nrow()

n_placebo <- n_completed_placebo + n_discontinued_placebo + n_not_received_placebo

n_completed_29_placebo <- combined_dataset %>%
  filter(group == "placebo",
          completed_29 == "yes") %>% nrow()

n_withdrew_trial_placebo <- combined_dataset %>%
  filter(group == "placebo",
          withdrew_trial == "yes") %>% nrow()

n_died_placebo <- combined_dataset %>%
  filter(group == "placebo",
          died == "yes") %>% nrow()

n_other_trial_placebo <- combined_dataset %>%
  filter(group == "placebo",
          other_trial == "yes") %>% nrow()

n_discontinued_trial_placebo <- n_withdrew_trial_placebo + n_died_placebo + n_other_trial_placebo

n_mod_itt_placebo <- combined_dataset %>%
  filter(group == "placebo",
          mod_itt == "yes") %>% nrow()

n_hospitalized_placebo <- combined_dataset %>%
  filter(group == "placebo",
          hospitalized == "yes") %>% nrow()

n_not_received_trial_placebo <- combined_dataset %>%
  filter(group == "placebo",
          not_received_trial == "yes") %>% nrow()

n_excluded_placebo <-  n_hospitalized_placebo + n_not_received_trial_placebo

####
n_randomized <- n_molnupiravir + n_placebo

n_not_randomized <- combined_dataset %>%
  filter (allocated == "excluded") %>% nrow()

n_eligible <- n_randomized + n_not_randomized
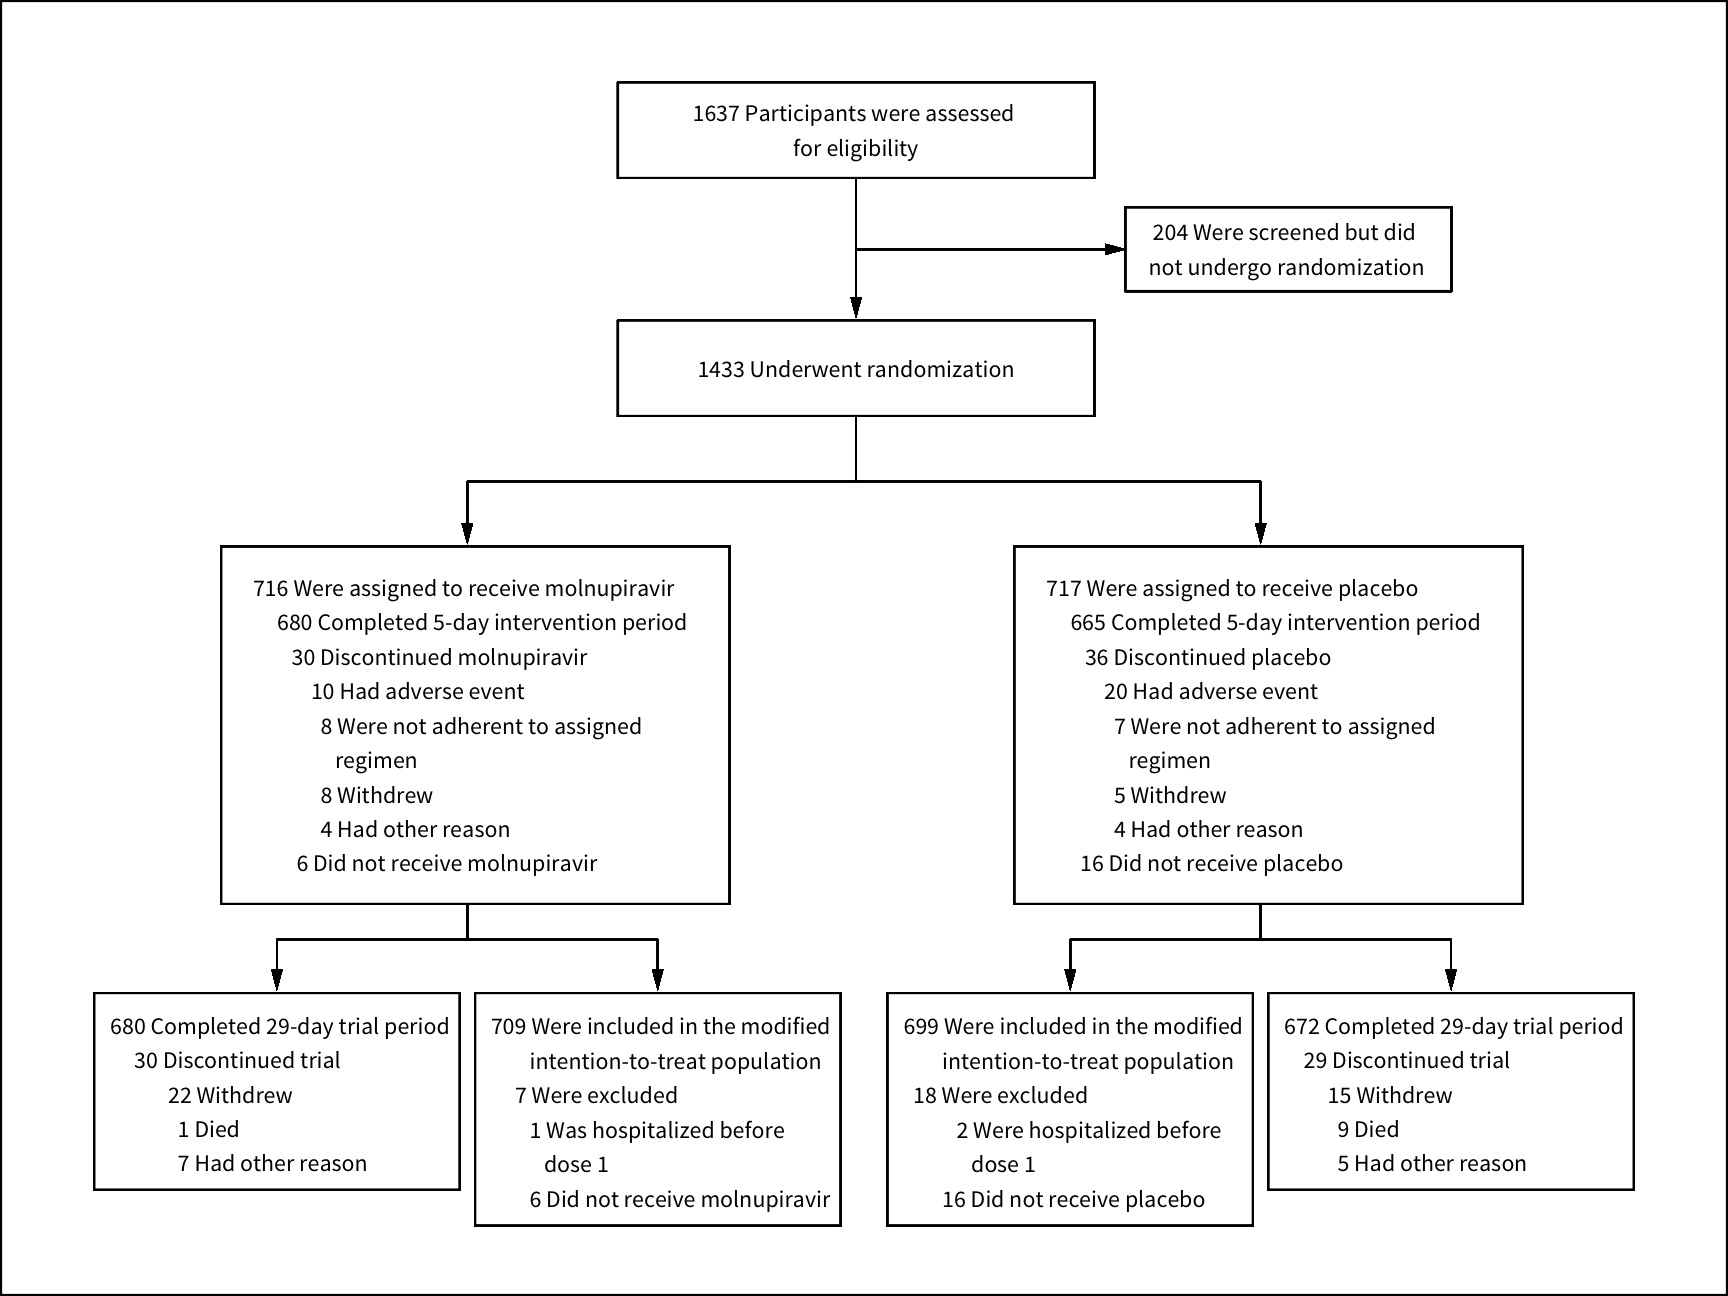
R codes for the figure
empty_canvas <- tibble(x= 1:100, y= 1:100) %>%
  ggplot(aes(x, y))

flow_diagram <- empty_canvas +

  # eligibility
  geom_rect(xmin = 35, xmax=65, ymin=90, ymax=98, color="black", fill="white", size=0.5) +
  annotate("text", x= 50, y=94, size=4.2, color = "black", family = "Source Sans Pro",
           label= paste0(n_eligible, " Participants were assessed \nfor eligibility")) +

  # not-randomized
  geom_rect(xmin = 67, xmax=87.5, ymin=80.5, ymax=87.5, color="black", fill="white", size=0.5) +
  annotate("text", x= 77, y=84, size=4.2, color = "black", family = "Source Sans Pro",
           label= paste0(n_not_randomized, " Were screened but did\n not undergo randomization")) +

  # randomized

  geom_rect(xmin = 35, xmax=65, ymin=70, ymax=78, color="black", fill="white", size=0.5) +
  annotate("text", x= 50, y=74,size=4.2, color = "black", family = "Source Sans Pro",
           label= paste0(n_randomized, " Underwent randomization")) +

  # left-side
  geom_rect(xmin = 10, xmax=42, ymin=29, ymax=59, color="black", fill="white", size=0.5) +
  annotate("text", x= 12, y=44, size=4.2, color = "black", family = "Source Sans Pro", hjust = 0,
           label= paste0(n_molnupiravir, " Were assigned to receive molnupiravir\n",
                        "     ", n_completed, " Completed 5-day intervention period\n",
                        "        ", n_discontinued, " Discontinued molnupiravir\n",
                        "            ", n_adverse, " Had adverse event\n",
                        "              ", n_not_adherent, " Were not adherent to assigned \n                 regimen\n",
                        "              ", n_withdrew, " Withdrew\n",
                        "              ", n_other, " Had other reason\n",
                        "         ", n_not_received, " Did not receive molnupiravir")) +

  geom_rect(xmin = 2, xmax=25, ymin=5, ymax=21.5, color="black", fill="white", size=0.5) +
  annotate("text", x= 3, y=13, size=4.2, color = "black", family = "Source Sans Pro", hjust = 0,
            label= paste0(n_completed_29, " Completed 29-day trial period\n",
                          "     ", n_discontinued_trial, " Discontinued trial\n",
                          "            ", n_withdrew_trial, " Withdrew\n",
                          "              ", n_died, " Died\n",
                          "              ", n_other_trial, " Had other reason")) +

  geom_rect(xmin = 26, xmax=49, ymin=2, ymax=21.5, color="black", fill="white", size=0.5) +
  annotate("text", x= 27, y=11.5, size=4.2, color = "black", family = "Source Sans Pro", hjust = 0,
            label= paste0(n_mod_itt, " Were included in the modified\n        intention-to-treat population\n",
                          "     ", n_excluded, " Were excluded\n",
                          "        ", n_hospitalized, " Was hospitalized before\n           dose 1\n",
                          "        ", n_not_received_trial, " Did not receive molnupiravir")) +

  # right-side
  geom_rect(xmin = 60, xmax=92, ymin=29, ymax=59, color="black", fill="white", size=0.5) +
  annotate("text", x= 62, y=44, size=4.2, color = "black", family = "Source Sans Pro", hjust = 0,
           label= paste0(n_placebo, " Were assigned to receive placebo\n",
                        "     ", n_completed_placebo, " Completed 5-day intervention period\n",
                        "        ", n_discontinued_placebo, " Discontinued placebo\n",
                        "            ", n_adverse_placebo, " Had adverse event\n",
                        "              ", n_not_adherent_placebo, " Were not adherent to assigned \n                 regimen\n",
                        "              ", n_withdrew_placebo, " Withdrew\n",
                        "              ", n_other_placebo, " Had other reason\n",
                        "       ", n_not_received_placebo, " Did not receive placebo")) +

  geom_rect(xmin = 52, xmax=75, ymin=2, ymax=21.5, color="black", fill="white", size=0.5) +
  annotate("text", x= 53, y=11.5, size=4.2, color = "black", family = "Source Sans Pro", hjust = 0,
            label= paste0(n_mod_itt_placebo, " Were included in the modified\n        intention-to-treat population\n",
                          "  ", n_excluded_placebo, " Were excluded\n",
                          "           ", n_hospitalized_placebo, " Were hospitalized before\n              dose 1\n",
                          "        ", n_not_received_trial_placebo, " Did not receive placebo")) +

  geom_rect(xmin = 76, xmax=99, ymin=5, ymax=21.5, color="black", fill="white", size=0.5) +
  annotate("text", x= 77, y=13, size=4.2, color = "black", family = "Source Sans Pro", hjust = 0,
            label= paste0(n_completed_29_placebo, " Completed 29-day trial period\n",
                          "    ", n_discontinued_trial_placebo, " Discontinued trial\n",
                          "         ", n_withdrew_trial_placebo, " Withdrew\n",
                          "           ", n_died_placebo, " Died\n",
                          "           ", n_other_trial_placebo, " Had other reason")) +

  # arrows
  geom_segment(x=50, xend=50, y=90, yend=78.5, size=0.4, linejoin = "mitre", lineend = "butt", arrow = arrow(length = unit(3, "mm"), type= "closed", angle=15)) +
  geom_segment(x=50, xend=66.8, y=84, yend=84, size=0.4, linejoin = "mitre", lineend = "butt", arrow = arrow(length = unit(3, "mm"), type= "closed", angle=15)) +
  geom_segment(x=50, xend=50, y=70, yend=64.5, size=0.4, linejoin = "mitre", lineend = "butt") +
  geom_segment(x=25.5, xend=75.5, y=64.5, yend=64.5, size=0.4, linejoin = "mitre", lineend = "butt") +
  geom_segment(x=25.5, xend=25.5, y=64.5, yend=59.5, size=0.4, linejoin = "mitre", lineend = "butt", arrow = arrow(length = unit(3, "mm"), type= "closed", angle=15)) +
  geom_segment(x=75.5, xend=75.5, y=64.5, yend=59.5, size=0.4, linejoin = "mitre", lineend = "butt", arrow = arrow(length = unit(3, "mm"), type= "closed", angle=15)) +
  geom_segment(x=25.5, xend=25.5, y=29, yend=26, size=0.4, linejoin = "mitre", lineend = "butt") +
  geom_segment(x=75.5, xend=75.5, y=29, yend=26, size=0.4, linejoin = "mitre", lineend = "butt") +
  geom_segment(x=13.5, xend=37.5, y=26, yend=26, size=0.4, linejoin = "mitre", lineend = "butt") +
  geom_segment(x=63.5, xend=87.5, y=26, yend=26, size=0.4, linejoin = "mitre", lineend = "butt") +
  geom_segment(x=13.5, xend=13.5, y=26, yend=22, size=0.4, linejoin = "mitre", lineend = "butt", arrow = arrow(length = unit(3, "mm"), type= "closed", angle=15)) +
  geom_segment(x=63.5, xend=63.5, y=26, yend=22, size=0.4, linejoin = "mitre", lineend = "butt", arrow = arrow(length = unit(3, "mm"), type= "closed", angle=15)) +
  geom_segment(x=37.5, xend=37.5, y=26, yend=22, size=0.4, linejoin = "mitre", lineend = "butt", arrow = arrow(length = unit(3, "mm"), type= "closed", angle=15)) +
  geom_segment(x=87.5, xend=87.5, y=26, yend=22, size=0.4, linejoin = "mitre", lineend = "butt", arrow = arrow(length = unit(3, "mm"), type= "closed", angle=15)) +


  theme_void() +

  theme(panel.border = element_rect(color = "black", fill = NA, size = 1))

### SAVE FIGURE
ggsave(
  flow_diagram,
  file = "w5_replica.jpeg",
  width = 12,
  height = 9,
  dpi = 144
  )
Final replica
Some personal comments:
- I want to hear about the packages to make a flow diagram. I ll share another with visR in the future.
Citation
Ali Guner (Feb 14, 2022) Week-5. Retrieved from https://datavizmed.com/blog/2022-02-14-week-5/
@misc{ 2022-week-5,
author = { Ali Guner },
title = { Week-5 },
url = { https://datavizmed.com/blog/2022-02-14-week-5/ },
year = { 2022 }
updated = { Feb 14, 2022 }
}